Radio Garden
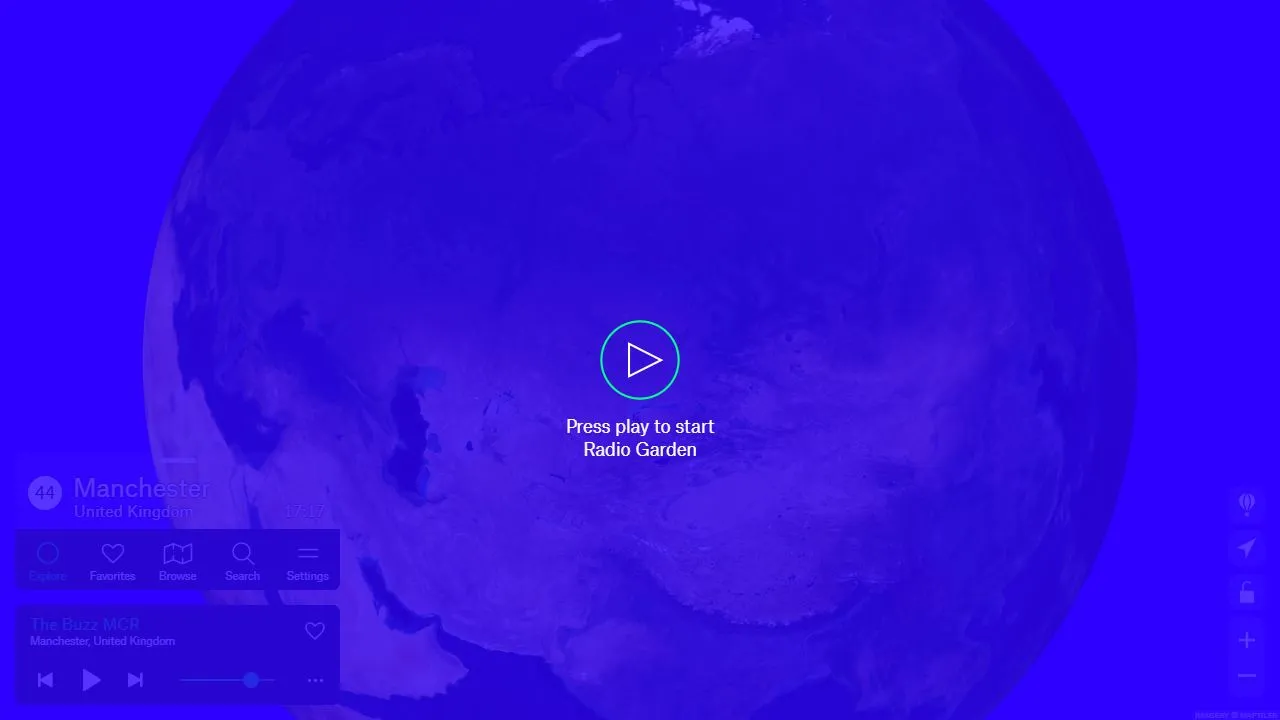
Radio Garden puts thousands of live stations on an interactive map. It is useful as a radio player, but the real appeal is being able to move from a familiar city to somewhere you know nothing about in seconds.
GOOD WEBSITES,
WORTH OPENING.
BROWSE THE COLLECTION / 76
Search by what you need, browse by type, or let us choose. Each entry includes a real screenshot, a practical summary and a full editorial review.

Radio Garden puts thousands of live stations on an interactive map. It is useful as a radio player, but the real appeal is being able to move from a familiar city to somewhere you know nothing about in seconds.

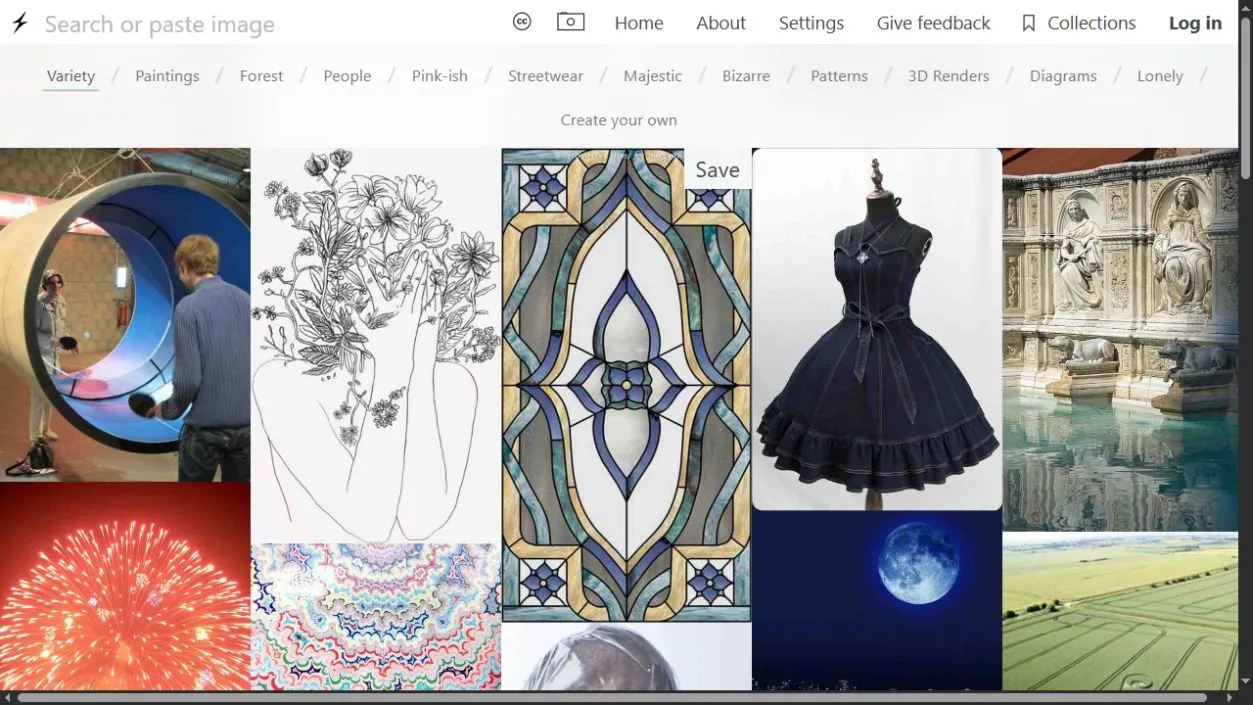
Same Energy is for the moment when you can recognise the image you need but cannot describe it. Start with a picture or a broad visual category, then move through related images by similarity rather than keywords.

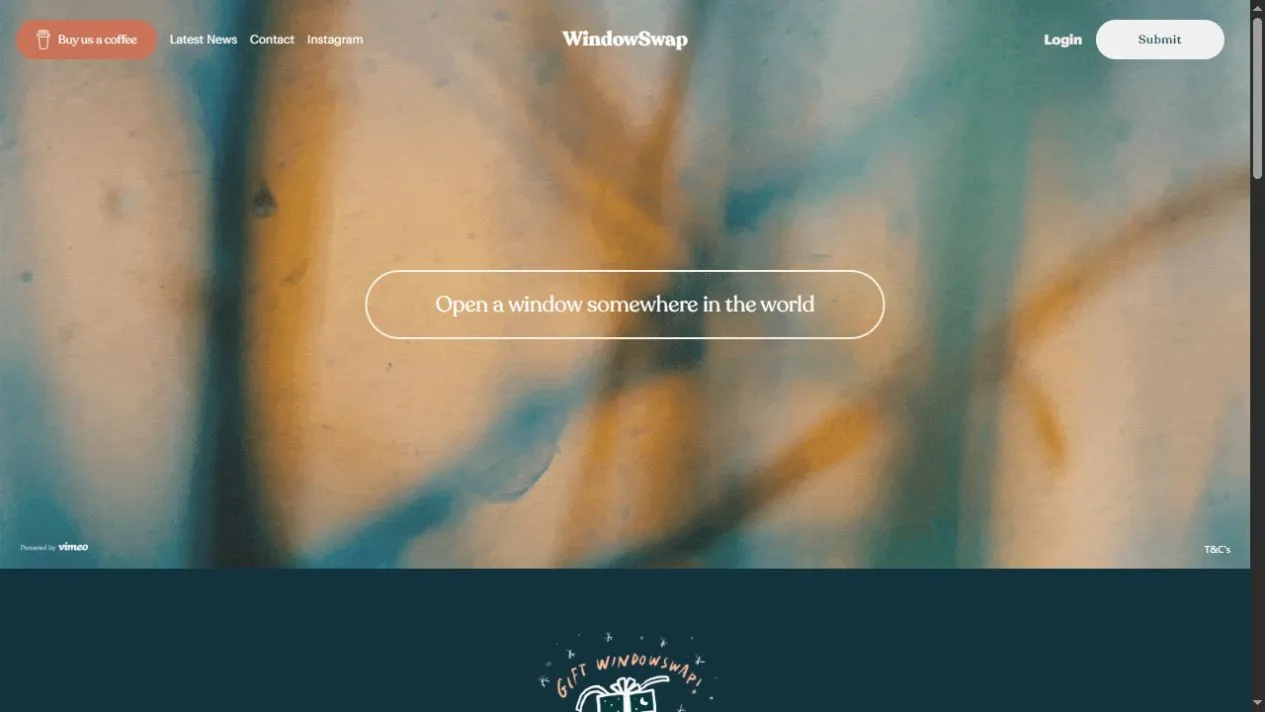
WindowSwap shows submitted window views from homes around the world. The videos are deliberately uneventful: weather, traffic, birds, neighbours and the sound of a room continuing somewhere else.

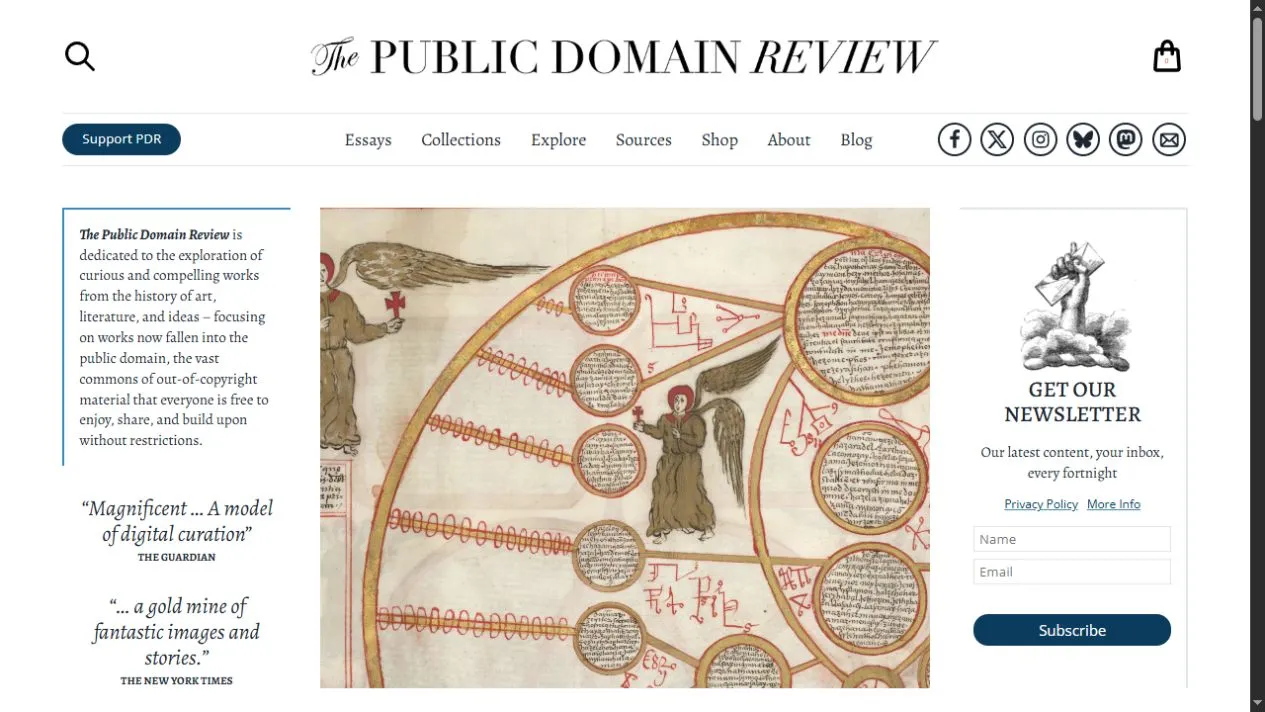
The Public Domain Review is an editorial project devoted to unusual works from art, literature and the history of ideas. It combines careful essays with image collections drawn from material that is free of known copyright restrictions.

Are.na lets you save images, links, files and text into channels that can remain private or connect with other people’s collections. It feels closer to a shared notebook or studio wall than a conventional social feed.

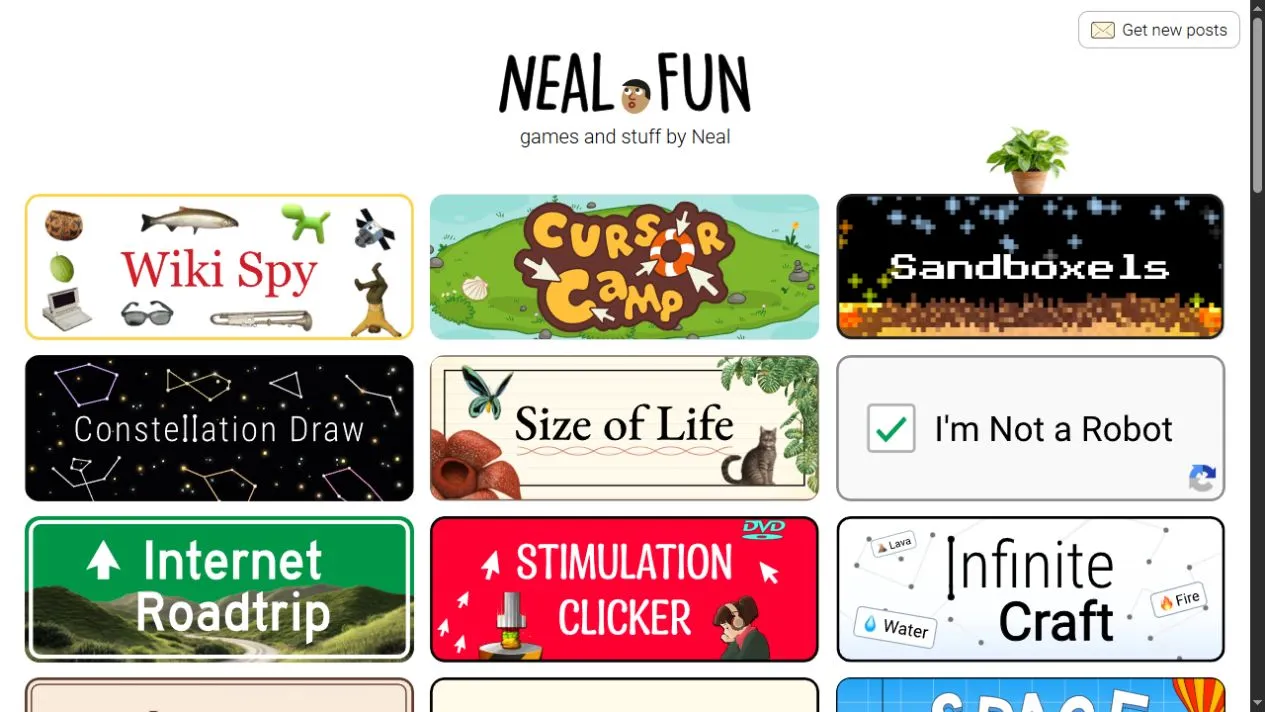
Neal.fun is a growing collection of projects that explain an idea by letting you interact with it. Some are games, some are visual essays, and some are difficult to classify beyond “this belongs in a browser.”

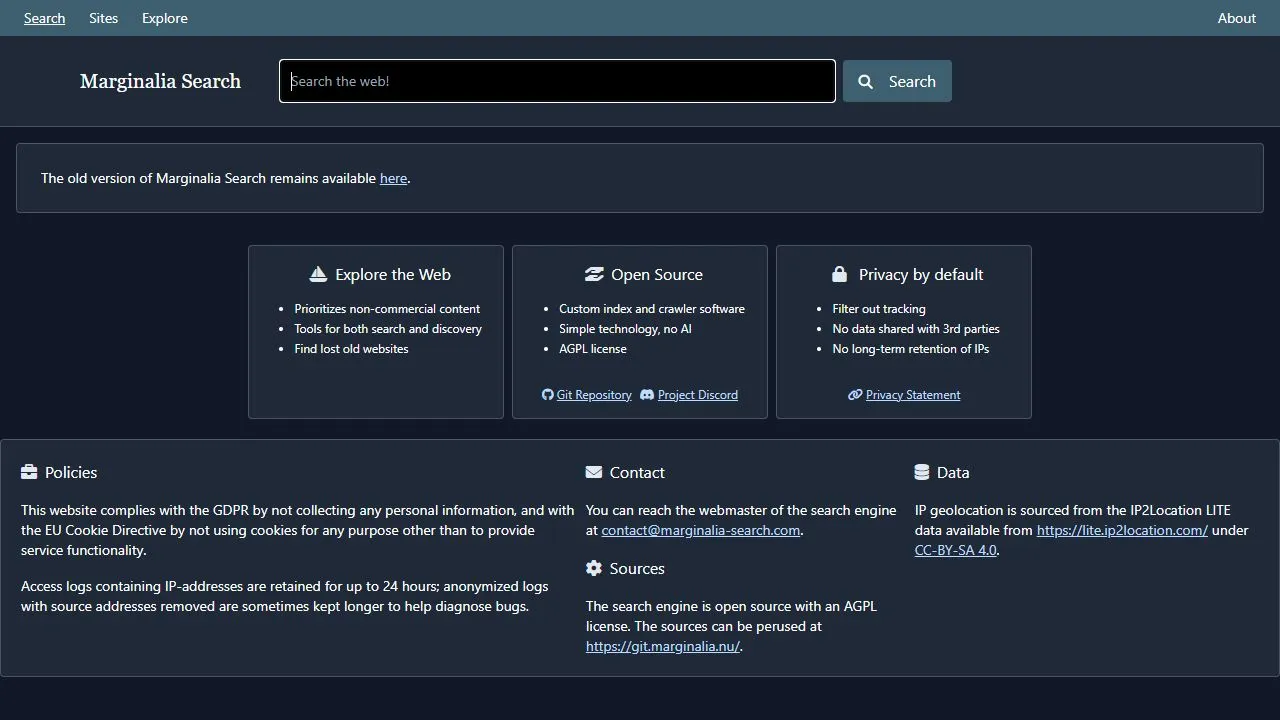
Marginalia Search deliberately favours small, text-heavy and independent websites over the pages that dominate conventional search results. It is one of the clearest ways to look beyond the commercial web without relying on a random-site button.

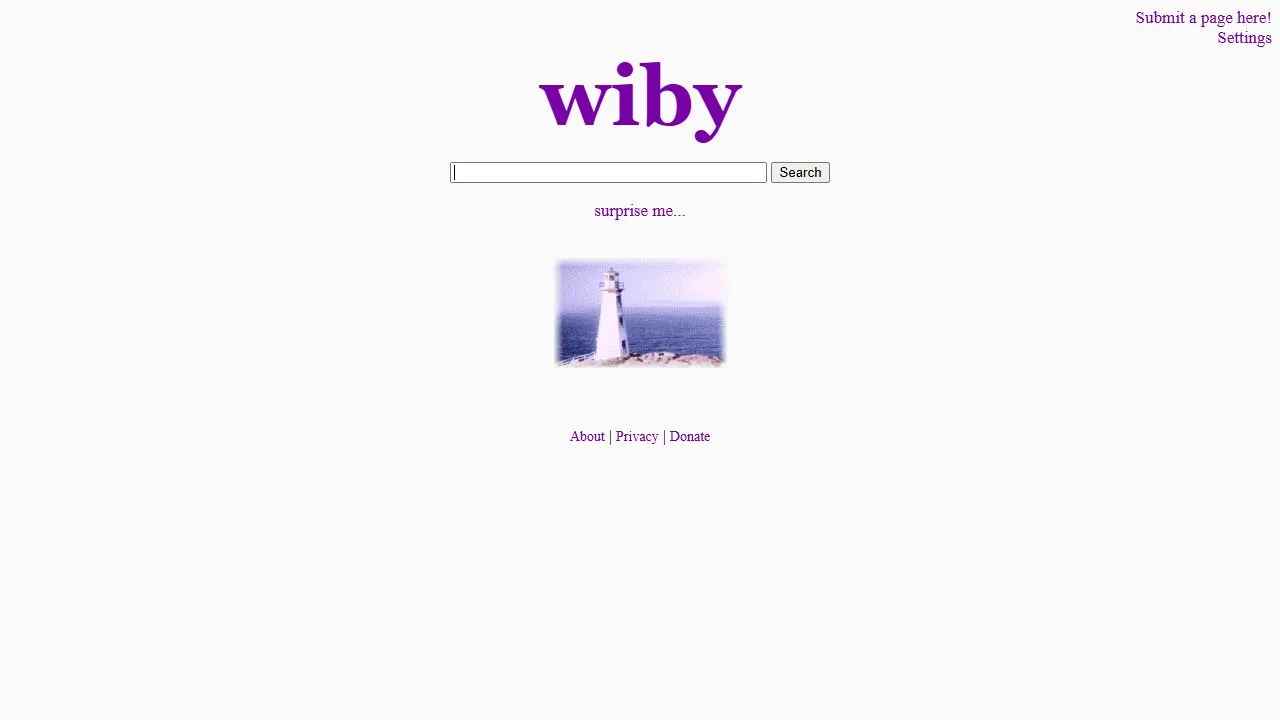
Wiby searches a deliberately compact index of lightweight pages that resemble the early personal web: hobby sites, essays, collections and small projects with little interest in growth hacking.

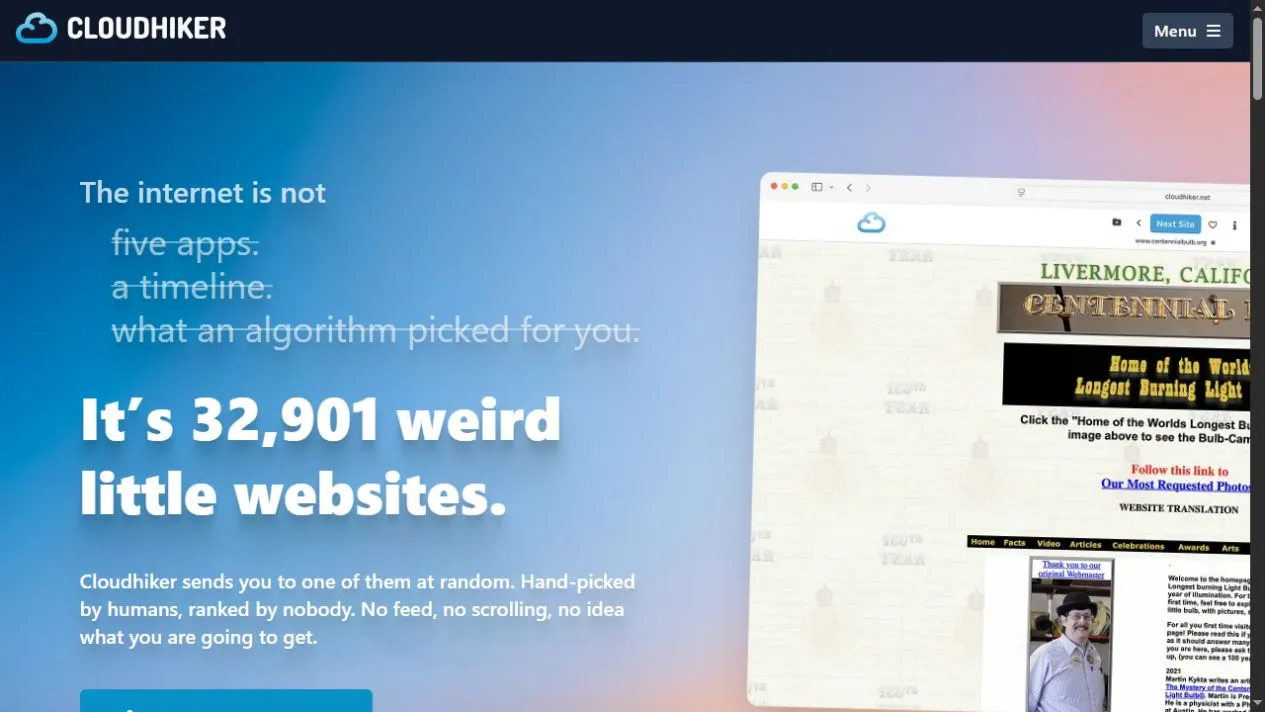
Cloudhiker maintains a large catalogue of unusual websites and turns it into a guided random walk. Categories and community ratings add enough structure to avoid the dead-link feeling of older random-web projects.

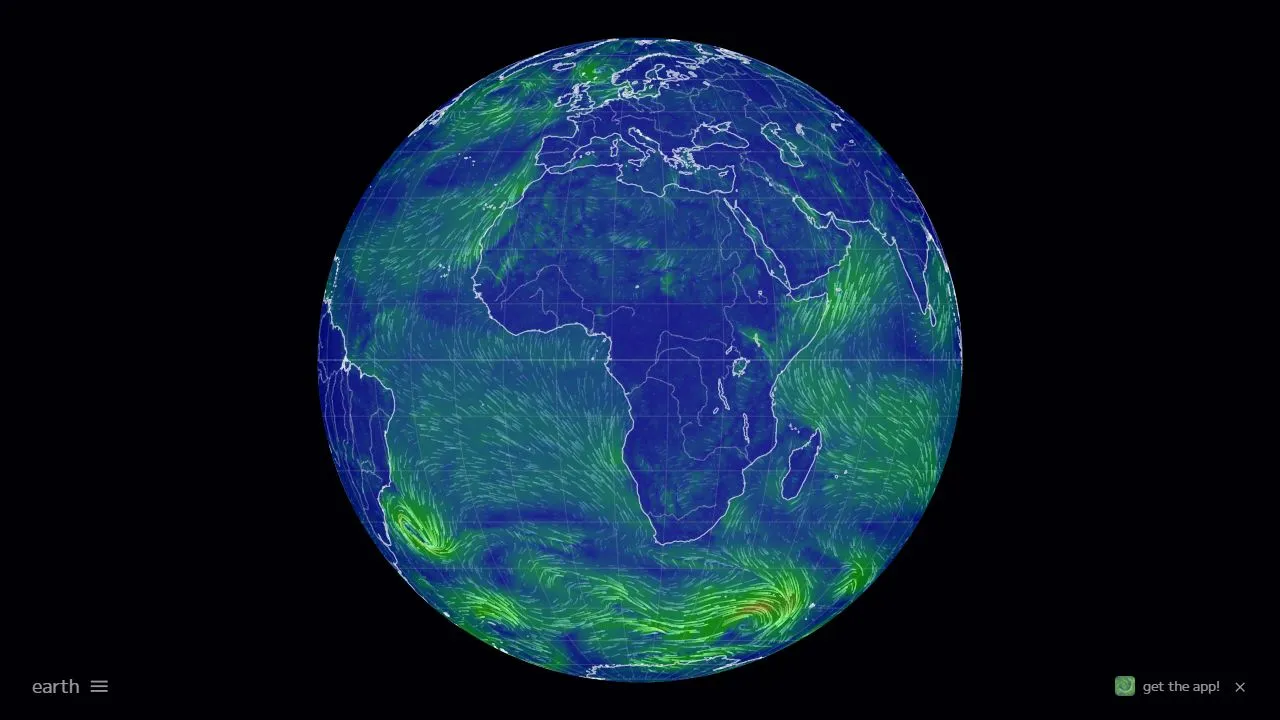
Earth Nullschool turns global forecast and observation datasets into a fluid, explorable globe. Wind becomes moving particles, while overlays reveal temperature, ocean currents, waves and atmospheric chemistry.

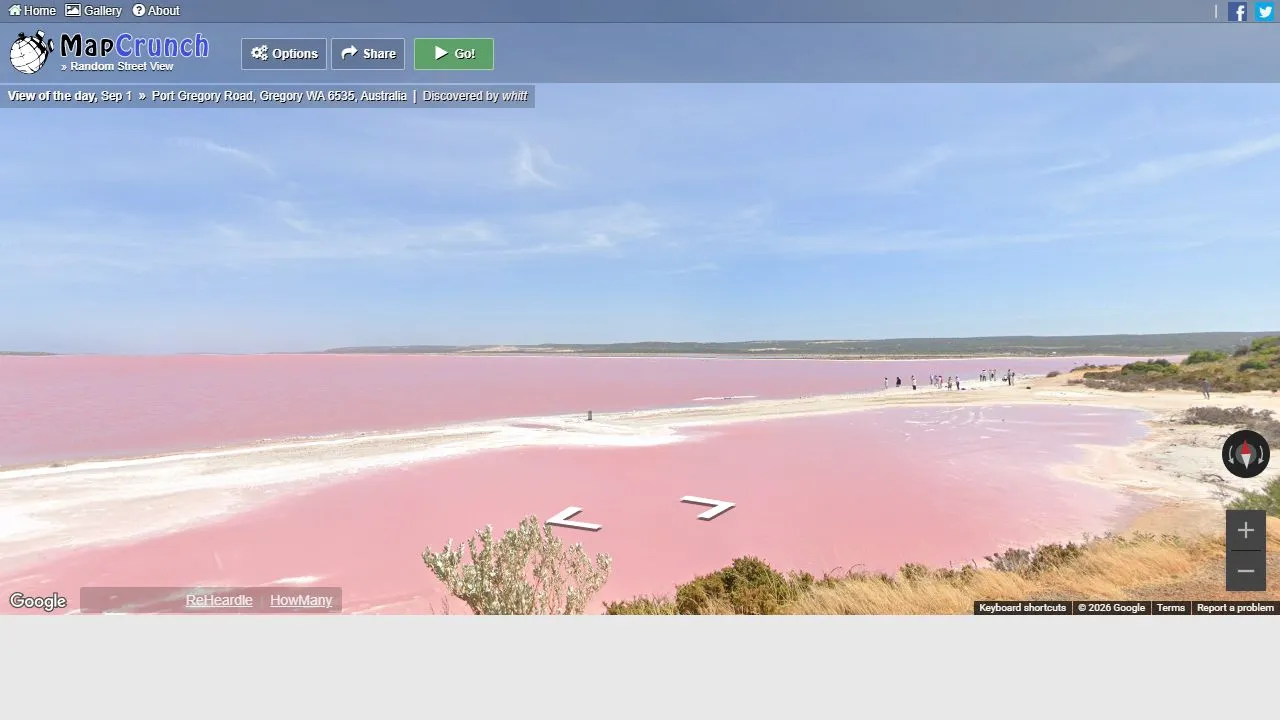
MapCrunch drops you into a random Google Street View location and removes the need to decide where to go first. Geographic filters can keep the journey within a country or region when completely random travel is too broad.

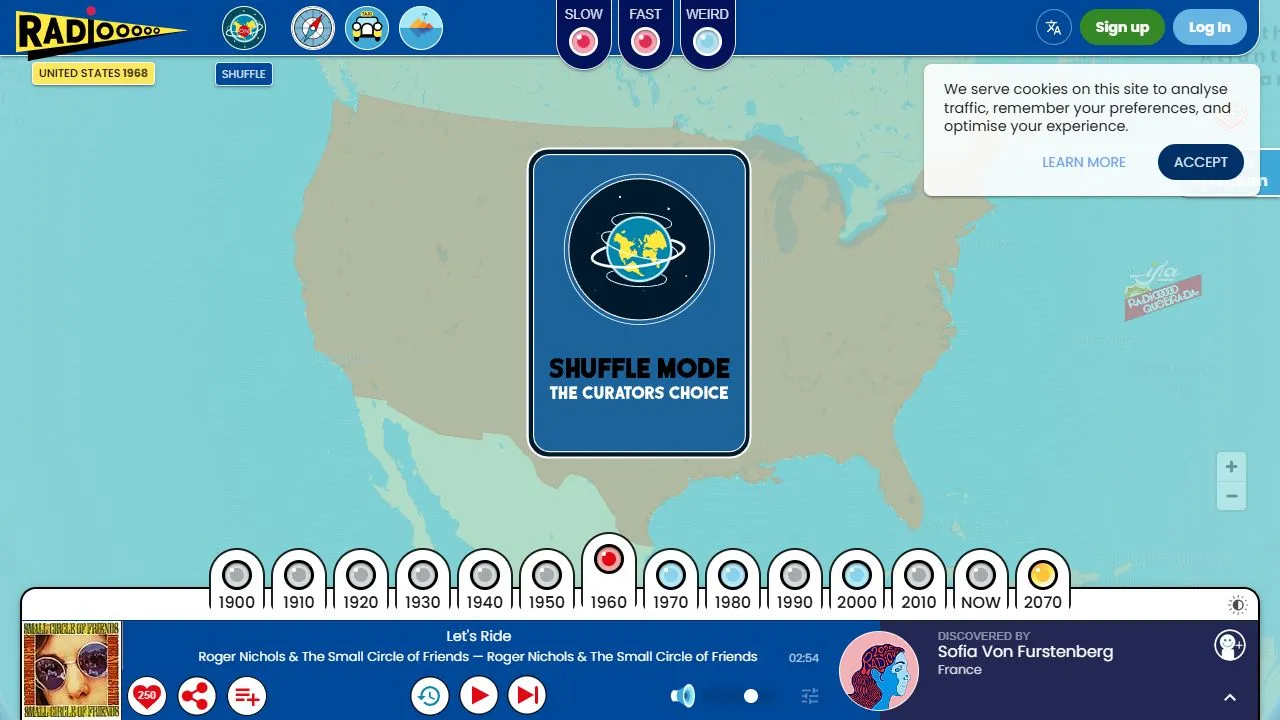
Radiooooo presents recorded music as a map and timeline. Choose a country, select a decade and let the station move through tracks associated with that place and period.
Patatap maps every letter key to a short sound and a full-screen animation. There is no setup, score or project file: press keys, find a rhythm and watch the visual system respond.

Zoomquilt is a continuous journey through nested illustrated scenes. Artists contributed connected frames that dissolve into one another, creating the convincing impression of an image with no final depth.

Library of Babel turns Jorge Luis Borges’s fictional library into an algorithmic website. Every possible page made from its limited alphabet has a stable address, including every sentence you could search for and an overwhelming amount of nonsense.

Internet Artifacts moves through network history using interfaces, files, clips and reconstructed moments rather than a conventional essay. The result feels closer to walking through a compact museum than reading a list of milestones.

The Pudding publishes reported stories built around data, interaction and original visual systems. Each piece chooses a format for its subject instead of forcing every story into the same article template.

Nicky Case makes interactive explainers that turn abstract systems into small things you can play. Instead of illustrating an argument after the fact, the interaction itself becomes the explanation.

Our World in Data combines explanatory writing with reusable charts and downloadable datasets on health, energy, population, inequality, technology and the environment.

Project Gutenberg offers tens of thousands of ebooks that can be read online or downloaded in open formats. Its catalogue is strongest in older literature whose United States copyright has expired.

Standard Ebooks takes public-domain texts and rebuilds them as consistent, proofread and typographically considered ebooks. Every title is also an open-source production project.

Europeana brings together records from museums, galleries, libraries and archives across Europe. Search can move across objects, photographs, manuscripts, newspapers, sound and film without knowing which institution holds them.

The Digital Public Library of America aggregates photographs, documents, books, maps and audiovisual records from libraries and archives across the United States.

Smithsonian Open Access makes millions of digital collection assets available under Creative Commons Zero, including images and data from art, science, history and culture collections.

Photopea handles PSD, XCF, Sketch, SVG and common image formats in a desktop-style editor. Layers, masks, selections, smart objects and export tools make it useful for serious edits when installed software is unavailable.

Excalidraw makes diagrams from boxes, arrows, text and freehand marks without turning every thought into a polished presentation. Drawings can remain local, be saved as files or shared through collaboration sessions.

Squoosh compares an original image with compressed output in real time. Resize controls and multiple codecs make it easy to see exactly how much quality a smaller file is costing.

Tiny Helpers collects small browser utilities for colour, accessibility, CSS, typography, performance, images and code. Most links solve one narrow task without requiring a large platform or account.

SVGOMG exposes SVGO’s optimisation controls beside a live preview. Paste markup or open a file, then remove editor metadata, simplify paths and reduce precision while watching for visible damage.

A Soft Murmur lets you combine looping environmental sounds and control each volume independently. The result can mask distracting noise without demanding attention like music or speech.

Music For Programming is a numbered series of long mixes designed to sit behind focused work. The austere player avoids recommendations, comments and a constantly changing homepage.

Stowaway turns aircraft and satellite tracking into a view from the ground or a virtual window seat. Select something overhead and follow its journey through a rendered sky and terrain, rather than reading positions on a conventional flight map.

Energy Maps presents US residential and commercial energy costs as maps, historical charts and comparisons. Switch between electricity and natural gas, explore individual states and distinguish nominal prices from inflation-adjusted figures.

Where the Shadow Fell maps solar eclipses from 2000 BCE to 3000 CE. Filter by eclipse type and period, inspect events around the globe, or switch to a grid that shows how eclipse families repeat over time.

ShadeMap combines a searchable map with date and time controls to visualise shadows from terrain, buildings and trees. It is a practical starting point for thinking about garden sunlight, outdoor seating or the light at a photography location.

Every Cube gives cube configurations a numerical address and lets you move through them with a slider or scroll wheel. Switch between a flat layout and a three-dimensional cube, or jump straight to patterns such as Checkerboard and Superflip.

Celestial is a solar system you can alter: change gravity, follow a planet, add a body or remove one and watch the simulation respond. Camera, speed and scale controls help make orbital relationships easier to examine.

The Music Lab’s Tone-Deafness Test invites visitors to listen to sounds and answer questions as part of a citizen-science study. Its introduction explains the research, voluntary participation and the kinds of background questions involved.

RetroCast turns a local forecast into a sequence of old-style television weather screens. Current conditions, regional comparisons and forecasts rotate through a deliberately dated visual format, using present-day weather rather than archived broadcasts.

Xikipedia presents Simple English Wikipedia content as a social-style feed. Its locally running recommendation algorithm adapts to engagement, making it both a way to discover articles and a demonstration of how quickly a feed can narrow around your interests.

MyBreedMatch combines a breed questionnaire with a searchable dog database, side-by-side comparisons and ownership resources. It focuses on practical compatibility—energy, space, grooming and available time—rather than choosing a dog solely by appearance.

How Poor Am I? lets you choose a country and enter annual income or personal net wealth to explore your estimated position. Distribution charts, country comparisons and source notes put the result alongside the broader concentration of wealth.

Screen Toys collects Gavin Shapiro’s interactive experiments, including a wood-splitting simulation, a sliding puzzle and a chaotic reinterpretation of chess. Other entries lead to animated visualisers that can accompany music or fill a second screen.

S80 repeatedly requests selected web endpoints and plots their response times, alongside minimum, maximum and average measurements. It offers a quick way to observe latency variation across destinations without opening a terminal.

The True Size turns a familiar map misconception into something you can test directly. Search for a country, move its outline towards or away from the equator, and watch it grow or shrink on the projection while its real area stays the same.

River Runner Global traces a path from a selected point through streams and rivers towards the sea—or towards an inland basin. The animated journey makes watersheds legible at a human pace and shows how a local slope connects to a much larger drainage system.

TeleGeography’s Submarine Cable Map plots active and planned undersea communications cables, their landing stations and the companies connected with them. Search by country, cable or year to see the physical routes beneath an apparently wireless internet.

The Internet Archive’s Wayback Machine lets you enter a URL and browse captures made across years. It is invaluable for recovering vanished references, checking how a website changed, and understanding that the public web has a history beyond its current version.

Musicmap arranges hundreds of popular music genres on a zoomable timeline called the Carta. Connections distinguish parent genres, secondary influences and backlashes, while individual panels add historical context and example tracks.

Chrome Music Lab collects colourful, single-purpose experiments for making and seeing music. Draw a melody, build a rhythm, inspect sound waves or turn a recorded sound into a picture without installing specialist software.

Listen to Wikipedia turns recent edits into a quiet audiovisual stream. Bells represent additions, plucked strings mark removals and the size of each circle reflects the scale of the change, giving collaborative editing an ambient physical presence.

City Roads takes a place name, retrieves its street network from OpenStreetMap and reduces it to lines on a blank field. The result exposes the grain of a city—grids, ring roads, cul-de-sacs and irregular historic centres—without labels competing for attention.

Seeing Theory is a visual introduction to probability and statistics built around interactive explanations. Its chapters move from basic chance through distributions, frequentist and Bayesian inference, and regression, with controls that expose how the result changes.

CyberChef combines hundreds of small data operations in a visual workbench. Drag steps such as Base64 decoding, decompression, hashing or character conversion into a recipe, paste the input and inspect the output immediately.

Piskel provides a compact pixel editor with frames, layers, palettes and a live animation preview. It is built for sprites rather than general illustration, which keeps the controls focused and makes a small game asset easy to begin.

Twine is an open-source tool for nonlinear stories. A visual map keeps passages and choices visible, simple projects need no code, and variables, conditional logic, CSS and JavaScript are available when the narrative becomes more ambitious.

Explorable Explanations is a directory and manifesto for learning by interacting with an idea. Its collection ranges across mathematics, society, computing and science, linking to projects where changing a system is part of understanding it.

BeepBox is a compact browser music sequencer built around patterns, channels and a looping timeline. Notes are quick to place, instruments can be adjusted in depth, and the complete song is encoded in its link for unusually frictionless sharing.

JS Paint recreates the directness of classic Microsoft Paint while adding practical modern features. Open an image, crop or annotate it, work with familiar bitmap tools and save the result without waiting for a large graphics application to launch.

webkay demonstrates browser-visible information such as software, screen characteristics, network clues and approximate location. It makes a useful privacy lesson because the results appear without a conventional account or form.

Old Book Illustrations gathers scanned images from eighteenth-, nineteenth- and early twentieth-century books, with a particular focus on Victorian and French Romantic work. Records identify artists, engravers, techniques, subjects and source volumes.

Stellarium Web draws the sky for a chosen place and time, then lets you search for planets, stars, constellations and deep-sky objects. It is equally useful for planning an evening outside or learning what an unfamiliar point of light might be.

Chronas combines a historical world map with a timeline and layers for political, cultural and religious information. Instead of treating history as a sequence of disconnected dates, it lets you hold the place still and watch the surrounding world change.

OpenHistoricalMap applies the collaborative mapping model to the past. Its time controls reveal roads, buildings, boundaries and names that existed at different dates, while the underlying project invites contributors to improve the public-domain dataset.

Apollo 11 in Real Time aligns original mission material to the master mission clock. You can start just before launch, join at the equivalent moment today, or jump directly to a photograph, transmission, transcript line or mission milestone.

Scale of the Universe places cells, animals, buildings, planets and cosmic structures along a single zoomable range. The comparisons make extreme size differences tangible, while selectable objects provide short explanations without interrupting the journey.

Typatone maps letters to musical notes, so ordinary writing produces a repeating composition as it appears on screen. It is less a conventional sequencer than a playful way to hear rhythm and repetition hiding inside language.

Mosh-Lite is the free browser version of a real-time glitch editor. Load a local file or camera feed, combine effects, adjust their controls and export a deliberately damaged-looking image or clip without first learning a full video editor.

Thisissand turns the screen into a gravity-led drawing surface. Choose colours, release streams of tiny grains and build landscapes from accumulated layers, then browse the gallery to see how far other people push the same small set of tools.

Pointer Pointer does one unnecessary thing with total commitment: after the cursor stops, it finds a photograph in which a person appears to point directly at that location on the screen. The result is a tiny lesson in timing, framing and delightful overengineering.

Have I Been Pwned searches an email address against breaches loaded into its database and explains which services exposed what kinds of information. It turns vague concern into a list of accounts you can secure, while keeping password checks in a separate tool.

NASA Eyes on the Solar System places planets, moons, asteroids and missions inside a navigable three-dimensional model. Time controls and guided stories make it possible to inspect an orbit, follow a spacecraft or understand the geometry behind a mission event.

The University of Colorado Boulder’s PhET collection lets learners manipulate models across physics, chemistry, mathematics, earth science and biology. Sliders, measuring tools and immediate visual feedback make invisible relationships easier to test.

Public Work brings openly reusable images from institutions including The Met and New York Public Library into a highly visual search interface. Search normally, open an image’s source, or move through visually related material when words are not enough.

Mapillary layers billions of user-contributed street images onto a world map. It reaches roads, paths and dates that conventional street-view services may miss, while giving mappers a way to upload new coverage and inspect detected map features.

100,000 Stars is a WebGL journey through nearby stellar data, beginning with the scale of the Milky Way and moving towards named stars around the Sun. A guided tour and free navigation turn an abstract catalogue into a navigable sense of stellar distance.