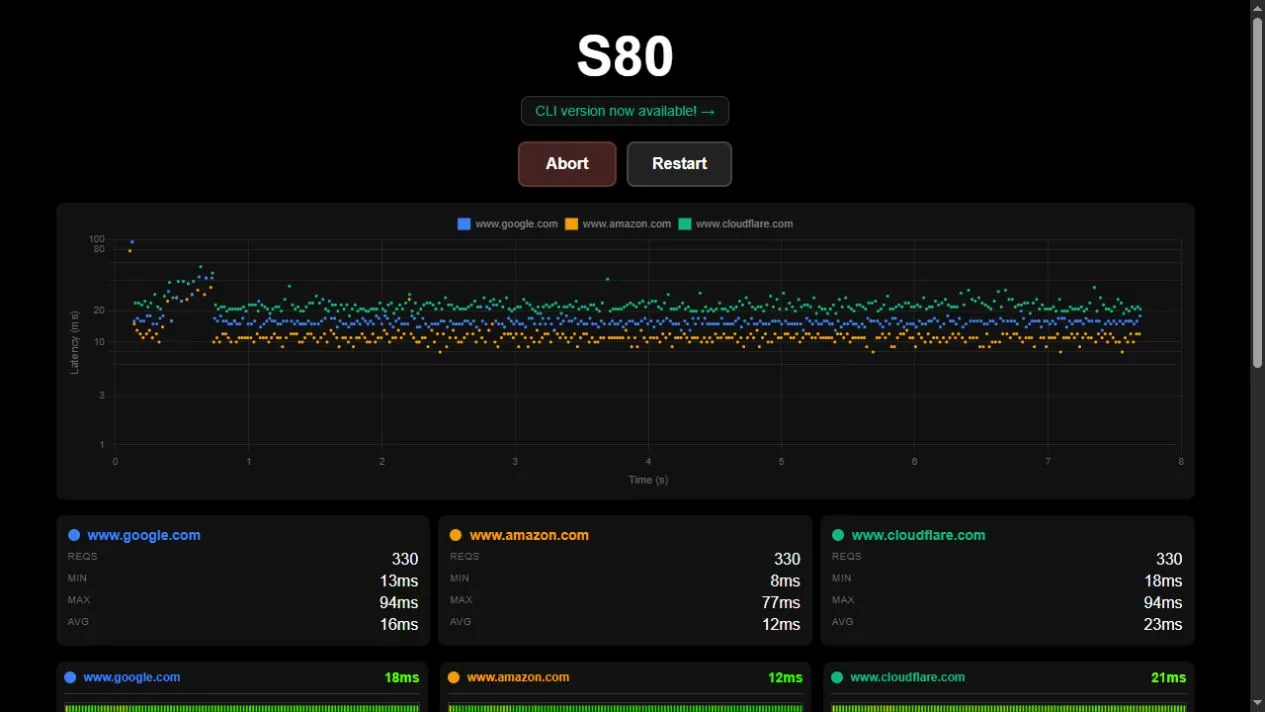
S80 repeatedly requests selected web endpoints and plots their response times, alongside minimum, maximum and average measurements. It offers a quick way to observe latency variation across destinations without opening a terminal.
What it measures
The test reports HTTP request timing, not download bandwidth or raw ICMP ping. Browser behaviour, caching, the network route and the destination server can all influence the numbers.
Reading a run
Compare the graphs and the request counts rather than focusing on the lowest reading. Spikes across several endpoints suggest a different pattern from a slowdown affecting only one destination.
Control the traffic
Testing starts automatically. Abort stops it; the settings expose endpoint URLs, timeouts and delay controls for subsequent runs. Avoid leaving repeated tests running unnecessarily, especially on a metered connection.
Things to know
- Not a bandwidth speed test.
- One slow endpoint does not prove a local network fault.
- Repeated requests consume network resources.